
Zero-Waste Symfony: Stripping the Overhead

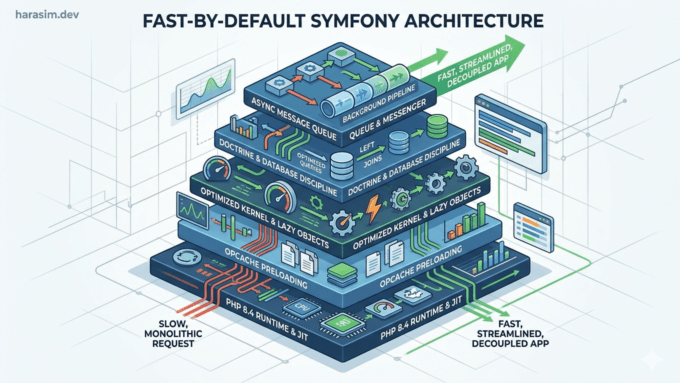
Performance is a feature, not a technical afterthought. In the high-stakes world of modern web development, a slow application is indistinguishable from a broken one. E-commerce platforms observe a 7% decline in conversion rates for every 100ms of latency, and for API-driven systems, the difference between 50ms and 200ms of overhead can be the deciding factor between a scalable product and an infrastructure budget that spirals out of control. Improving Symfony performance is not about finding a single “magic switch” but about implementing a disciplined, multi-layered approach that addresses the PHP runtime, the framework kernel, the data layer, and the asynchronous background processing pipeline.
The Foundation of the Modern PHP Runtime
A Symfony application is only as fast as the engine that executes it. The transition to PHP 8.4 and the upcoming 8.5 marks a significant shift in how the language handles the complex object graphs and dependency injection patterns that define the Symfony ecosystem.
The Impact of PHP 8.4 and 8.5 on Symfony Latency
Upgrading the runtime is the most cost-effective performance optimization available. Benchmarks show that Symfony requests on PHP 8.3 average 5.7ms, compared to 7.2ms on PHP 7.4. PHP 8.4 continues this trend, offering up to a 70% boost for specific CPU-bound operations through improved Just-In-Time (JIT) compilation and native support for lazy objects.
| Runtime Configuration | Performance Gain (Symfony) | Performance Gain (PHP) | Key Benefits |
|---|---|---|---|
| PHP 7.4 to PHP 8.3 | 20-35% | 15-20% | Major engine refactoring and JIT introduction. |
| PHP 8.3 to PHP 8.4 | 7-70% | 5-10% | Native Lazy Objects and better JIT support. |
| PHP 8.4 to PHP 8.5 | 3-5% | 3-5% | Refined URI parsing and object cloning. |
The performance gains in PHP 8.4 are largely driven by the engine’s ability to handle object instantiation more efficiently. Symfony 8 natively uses these enhancements, such as the HTML5 parser and lazy objects, which were integrated into the language specifically to meet the needs of modern frameworks. While the 3-5% gain from PHP 8.4 to 8.5 may seem marginal, it is cumulative and particularly relevant for high-traffic SaaS platforms where CPU cycles translate directly to hosting costs.
OPcache Strategy for Production Stability
OPcache is the single most critical component for PHP performance. It eliminates the need for PHP to load, parse, and compile scripts on every request. However, default settings are rarely sufficient for a production Symfony environment.
| Setting | Value | Rationale |
|---|---|---|
opcache.memory_consumption | 256 | Accommodates large codebases including vendor dependencies. |
opcache.max_accelerated_files | 32531 | Ensures all project files are stored in the cache. |
opcache.validate_timestamps | 0 | Prevents the engine from checking file changes on every request. |
opcache.interned_strings_buffer | 20 | Stores immutable strings (class names, keys) in shared memory. |
opcache.jit_buffer_size | 64M | Provides sufficient space for the JIT compiler’s machine code. |
Setting opcache.validate_timestamps=0 is non-negotiable for production. This tells PHP to never check if the source code has changed, effectively treating the filesystem as immutable. This requires a deployment process that clears the cache – either by restarting the web server, calling opcache_reset() via a script, or using a utility like cachetool.
The Evolution of OPcache Preloading
Introduced in PHP 7.4 and refined in 8.4, preloading allows the engine to compile a list of files at startup and make them available to all requests as if they were built-in functions. For high-throughput applications, this can reduce response times by 10% or more by eliminating the overhead of the autoloader.
In a typical Symfony app, autoloading takes between 10ms and 16ms. For an API with a response time below 100ms, preloading is a significant lever. Symfony facilitates this by generating a preload.php file during container compilation. However, preloading increases the memory footprint and the startup time of the PHP-FPM process. If an application already has a high response time (e.g., 500ms+), the relative benefit of saving 10ms on autoloading is negligible, and the engineering focus should shift to database or I/O bottlenecks.
Architectural Efficiency in the Framework Kernel
The Symfony kernel is designed for flexibility, but that flexibility comes with a performance baseline. A well-tuned kernel ensures that the framework’s internal processes – routing, service instantiation, and translation – consume the smallest possible portion of the request lifecycle.
Service Container Optimization
The dependency injection container is the brain of a Symfony application. By default, Symfony compiles this container into multiple small files to improve developer experience. In production, setting the parameter to dump the service container into a single file can improve performance, particularly when paired with OPcache preloading, as it reduces the number of file inclusion operations required to initialize the kernel.
A common performance trap is the “constructor heavy” service. Because Symfony initializes event listeners and their dependencies during the request bootstrap, any logic placed in a service constructor is executed even if the service is never used in that specific request. This is especially damaging if the service depends on the Doctrine Registry or a template engine, as it triggers a cascade of sub-service instantiations.
| Instantiation Trap | Impact | Resolution |
|---|---|---|
| Heavy work in constructor | High latency on every request | Use native PHP 8.4 lazy objects or lazy ghost services. |
| Injecting Twig into listeners | Unnecessary overhead for JSON APIs | Use the container for lazy retrieval or refactor the listener. |
| Deep dependency layers | Slow kernel bootstrap | Use service autowiring and private services to simplify the graph. |
The introduction of native lazy objects in PHP 8.4 allows Symfony to create “Ghost Objects” that initialize in-place only when a property is accessed. This strategy is more efficient than the older proxy-based solutions because it avoids the identity disparity between the proxy and the real instance.
Routing and Static Prefixing
The routing component is often the first major hurdle for a request. As an application grows to hundreds of routes, the cost of matching can rise significantly. Symfony optimizes this using a bit-masking approach and static prefix grouping.
To maximize routing performance, developers should group routes with common prefixes and place dynamic segments (e.g., {id}) as far to the right of the URI as possible. Simple string comparisons are orders of magnitude faster than regular expressions. If an application has a highly dynamic route that only has a handful of variants, writing them out explicitly as static routes can save several milliseconds per request. In one documented case, optimizing the generated routing code and HTTP method matching reduced routing time from 7.5ms to 2.5ms.
Realpath Cache and Filesystem I/O
Symfony is a “file-heavy” framework. A single request can involve checking the existence and timestamps of hundreds of PHP files, YAML configs, and translation fragments. The PHP realpath_cache stores the resolved absolute paths of these files to avoid repeated disk I/O.
| Cache Parameter | Recommended Value | Context |
|---|---|---|
realpath_cache_size | 4096K | Accommodates the high volume of file paths in Symfony. |
realpath_cache_ttl | 600 | Caches paths for 10 minutes, assuming code is immutable. |
It is important to note that PHP disables the realpath_cache if the open_basedir configuration is enabled, which can lead to a significant performance penalty on shared hosting environments.
The Data Layer: Doctrine ORM and Database Discipline
The database is where approximately 80% of performance issues reside. While Doctrine ORM provides a powerful abstraction, it can easily lead to the N+1 query problem or excessive memory consumption if not used with a “database-first” mindset.
The N+1 Query Problem and Eager Loading
The N+1 problem occurs when an application fetches a collection of entities and then, in a loop, fetches a related entity for each item in the collection. For a collection of 100 products, this results in 101 database queries instead of one.
The solution is to use the QueryBuilder to perform a leftJoin and an addSelect for the related entity. This instructs Doctrine to fetch all necessary data in a single SQL query and hydrate the related objects simultaneously.
// Eager Loading in ProductRepository
public function findAllWithCategories(): array
{
    return $this->createQueryBuilder('p')
        ->addSelect('c')
        ->leftJoin('p.category', 'c')
        ->getQuery()
        ->getResult(); // Executes exactly 1 query
}However, eager loading should be used carefully. If the related data is only needed in a small percentage of requests, lazy loading may be more efficient to keep the initial memory footprint low.
Bidirectional One-to-One Relations and Ownership
A common “silent” performance killer is the bidirectional One-to-One relationship. Doctrine defines an “owning side” (where the foreign key sits) and an “inverse side”. When the inverse side is loaded, Doctrine must perform an additional query to find the related record, as the table itself has no foreign key to check.
In a real-world debugging scenario, an application was generating 40,000 redundant queries per day because the owning side was placed on an entity that was fetched less frequently than its counterpart. Flipping the owning side to the more frequently queried entity eliminated these queries immediately.
Hydration and Native SQL for Read-Heavy Workloads
Doctrine’s hydration process – turning database rows into PHP objects – is one of the most expensive operations in the framework. For read-only dashboards or reports that process thousands of rows, the overhead of creating thousands of entity objects is often unnecessary.
| Fetch Mode | Execution Time | Memory Usage | Use Case |
|---|---|---|---|
| DQL (Full Hydration) | 4,500ms | 128MB | Complex domain logic, write operations. |
| DQL (Partial Objects) | 3,800ms | 110MB | Limited field access, still object-based. |
| Native SQL (Array) | 450ms | 12MB | Dashboards, high-throughput lists, exports. |
For high-performance read paths, using the DBAL layer to fetch associative arrays bypassing the ORM hydration is the most effective way to scale.
Scalability and Asynchronous Task Management
Synchronous request-response cycles are the enemy of perceived performance. If a user has to wait for an email to be sent or a video to be processed before the page reloads, the experience feels sluggish. Symfony Messenger provides the infrastructure to decouple these tasks and process them in the background.
Payload Compression and Bandwidth Costs
High-throughput systems often struggle with “fat payloads” in the message queue. Large JSON strings stored in Redis or Amazon SQS consume significant RAM and increase network latency.
With Symfony 7.4 and 8.0, the CompressStamp allows for native payload compression. In benchmarks, raw payloads that consumed 4.88GB of Redis RAM were reduced to 410MB after compression. While compression adds a CPU tax – increasing worker utilization – it shifts the bottleneck from the network to the processor, resulting in a 17% faster total dispatch time.
| Message State | Storage Size | CPU Impact | Processing Time |
|---|---|---|---|
| Raw Payload | 4.88GB | Low | 42s (Network bottleneck). |
| Compressed | 410MB | Moderate | 35s (Faster dispatch). |
| Compressed + Encrypted | 550MB | High (38%) | 48s (CPU bottleneck). |
Resiliency and Silent Failures in Workers
A robust performance strategy must also account for worker reliability. A common failure mode in Symfony Messenger is the “silent bug,” where a worker starts successfully but consumes nothing. This often occurs when auto_setup=0 is set in the DSN, but the required database tables have not been created manually.
Furthermore, if the PHP CLI and MySQL server timezones are out of sync, messages may be scheduled for the future relative to the worker’s clock, causing them to sit idle. Standardizing on UTC across the entire stack – FPM, CLI, and Database – is a critical step for preventing these latency-inducing disparities.
Leveraging Modern Symfony 8 Components
The release of Symfony 8 brings several new components specifically designed for high-efficiency data handling and reduced memory footprints.
High-Performance JSON with JsonStreamer
Traditional JSON encoders load the entire object graph into memory before producing a string. The new JsonStreamer component, introduced in Symfony 7.3 and core to Symfony 8, utilizes a streaming approach that achieves 10x faster serialization and 50% less memory usage for large data volumes.
JsonStreamer is ideal for DTO-based architectures where public properties are the norm. By applying the #[JsonStreamable] attribute, developers can pre-generate encoding logic during cache warm-up, further shaving milliseconds off API responses.
| JSON Strategy | Advantage | Disadvantage |
|---|---|---|
| Stream Decoding | Minimal memory usage, handles infinite files. | Slightly slower due to incremental parsing. |
| String Decoding | Maximum speed for small payloads. | High memory usage for large files. |
ObjectMapper and Data Transfer Objects
The ObjectMapper component simplifies the transfer of data between entities and DTOs, a task that has historically relied on the PropertyAccess component or manual mapping. The ObjectMapper achieves a 50% performance improvement over traditional mapping methods by leveraging the TypeInfo component and optimized internal loops. It can even bypass lazy ghost objects to access raw data directly when necessary.
Profiling and the Measurement Workflow
Performance optimization is a cycle of measurement and refinement. Without a baseline, any “optimization” is merely a configuration change with unknown impact.
Establishing a Baseline
Before optimizing, practitioners must establish an honest baseline using both micro-benchmarks (pure PHP logic) and end-to-end HTTP benchmarks using tools like wrk or k6. A target Service Level Objective (SLO), such as p95 < 150ms for a search endpoint, provides a clear success metric for the team.
Profiling in Production Conditions
The Symfony Profiler is a vital tool for development, but it introduces its own overhead and should never be used to measure absolute production performance.
- Blackfire: The industry standard for profiling Symfony applications. It provides a visual representation of the call graph and identifies precisely which services are consuming the most CPU time or memory.
- Symfony Stopwatch: A lightweight way to manually measure specific blocks of code within the application.
- Tideways: Useful for identifying slow event listeners and container lazy-loading issues that contribute to the framework overhead.
The Five Whys of Performance Degradation
When an application’s response time climbs from 120ms to 750ms, developers should employ the “Five Whys” technique to reach the root cause.
- Why is the server crashing? High CPU usage.
- Why is CPU usage high? Every request is performing intensive tasks.
- Why are tasks intensive? Routing has become expensive.
- Why is routing expensive? It is loading the entire route collection instead of the optimized cache.
- Why is it loading the collection? A misconfiguration is triggering the
YamlFileLoaderin production.
Engineering Management and CTO Strategy
For technology leaders, performance is a strategic investment. Beyond the code, the environment and infrastructure choices define the scalability limit of the organization.
Infrastructure and Hosting Choices
The emergence of FrankenPHP and RoadRunner offers a “daemon-style” alternative to the traditional PHP-FPM model. By keeping the application in memory between requests, these runtimes eliminate the framework bootstrap overhead entirely.
| Runtime Model | RPS | Relative Gain |
|---|---|---|
| PHP 7.2 | 845 | Baseline. |
| PHP 7.4 + OPcache | 931 | +10%. |
| PHP 7.4 + Preload | 1030 | +21%. |
| RoadRunner (Optimized) | 1089 | +28%. |
For CTOs, the choice between PHP-FPM and a worker-based model like FrankenPHP should be driven by the complexity of the application bootstrap. If the container compilation and service instantiation take a significant portion of the request, moving to a worker mode will yield the highest ROI.
The Strategic Performance Audit Checklist
Engineering managers should regularly audit their projects against a standardized checklist to ensure that performance does not degrade over time.
- Environment Check: Is
APP_DEBUGstrictlyfalsein production? Is the autoloader optimized viacomposer install --optimize-autoloader --no-dev?. - Doctrine Audit: Are we monitoring the slow query log? Are there any N+1 queries in the most frequent routes?.
- Caching Strategy: Are we utilizing HTTP caching (Varnish or Symfony’s reverse proxy) for public content? Is expensive data cached in APCu or Redis?.
- Asset Management: Are CSS and JS files minified and served via a CDN?.
- Async Capacity: Do we have enough consumers running to handle the message volume in our queues?.
Conclusion
Improving Symfony performance is a holistic endeavor that begins with the selection of the PHP 8.4 runtime and extends through meticulous database discipline and the adoption of modern, stream-based components. The framework provides the tools – OPcache preloading, lazy objects, JsonStreamer, and Messenger – but the engineering team must provide the discipline to use them correctly. By establishing a “Fast-by-Default” baseline and maintaining a rigorous profiling workflow, organizations can ensure that their Symfony applications remain performant, scalable, and cost-effective in an increasingly demanding digital landscape. Performance is not a final destination but a continuous standard that ensures the long-term viability and user satisfaction of the software product.