The SPACE Framework: A Guide to Sustainable Engineering Productivity
Software engineering teams often struggle with a context-switching death spiral. Developers spend more time in meetings than writing code. Constant interruptions destroy focus and prevent deep work. This fragmentation breaks systems and kills productivity. Most managers respond by counting commits or lines of code. This approach only makes things worse. It creates a toxic atmosphere where engineers game the system. The SPACE framework offers a better way. This guide provides a concrete architectural and code-based solution. It helps leaders build high-performing teams without the burnout.
Why Traditional Productivity Metrics Create Toxic Cultures
The history of software engineering measurement is filled with vanity metrics. These numbers look good on spreadsheets but fail in production environments. Most legacy systems rely on simple, quantifiable outputs. These include counting lines of code, commit frequency, and individual story points. These metrics are fundamentally flawed. They treat software development like a manufacturing line.
The Trap of Counting Lines of Code (LoC)
Counting lines of code is a crude and misleading measure of effort. A developer might remove five hundred lines of redundant code. This refactoring improves system performance and maintainability. However, a line-count metric would show this as negative productivity. This creates an incentive for verbose and poorly structured code. Engineers may avoid necessary cleanup to keep their numbers high. This leads to a “distributed mud nightmare” over time. High-quality software is often characterized by fewer lines of better code.
The Trap of Commit Statistics
Commit counts are another easily gamed metric. Some managers pull commit history to determine salary reviews. This forces developers to make small, atomic changes that lack cohesion. It makes the version control history difficult to read or bisect. High commit frequency often indicates frustration rather than progress. Research shows a correlation between negative affective states and high commit frequency. Engineers who are stuck in a cycle of iterative remediation often commit more frequently. Using these stats as a proxy for “hard work” is a management failure.
| Legacy Metric | Intended Goal | Real-World Failure | Cultural Outcome |
| Lines of Code | Measure output volume. | Rewards bloat and redundancy. | Increased technical debt. |
| Commit Frequency | Measure daily activity. | Encourages fragmented, poor-quality history. | High anxiety and micromanagement. |
| Tasks Closed | Measure throughput. | Leads to “cherry-picking” easy bugs. | Complex problems are neglected. |
| Individual Velocity | Measure personal speed. | Destroys collaboration and teamwork. | Knowledge silos and competition. |
The Illusion of Individual Story Points
Story points are designed for team capacity planning, not individual performance. Tracking velocity per person is a form of old-school micromanagement in agile clothing. It creates a leaderboard mentality that kills collaboration. Developers will stop helping teammates if it risks their own point count. Experts become gatekeepers who hoard knowledge to protect their standings. True agility relies on collective outcomes, not personal glory. When velocity becomes a target, it stops to be a useful measure.
Understanding the Five Dimensions of the SPACE Framework
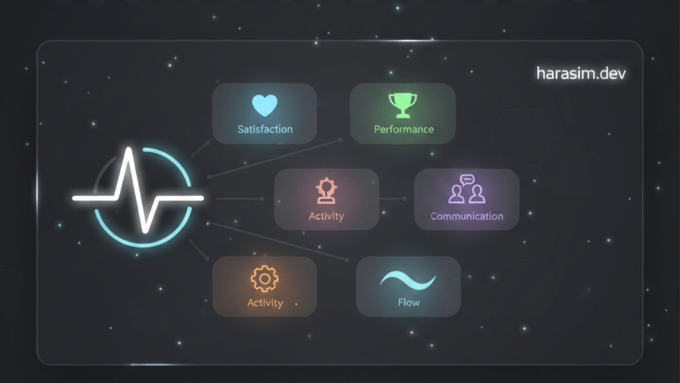
The SPACE framework captures the multidimensional nature of developer productivity. It was developed by experts from GitHub and Microsoft Research to move beyond output-based myths. The framework consists of five key dimensions: Satisfaction and well-being, Performance, Activity, Communication and collaboration, and Efficiency and flow. No single metric can tell the whole story. Leaders must examine a constellation of metrics in tension.
Satisfaction and well-being (S)
Satisfaction measures how fulfilled developers feel with their work environment and tools. Well-being tracks how healthy and happy engineers are. Happy developers are 13% more productive than unhappy ones. Unhappy developers do not just leave; they become less productive first. A decline in satisfaction is a leading indicator of burnout and reduced retention.
Key signals for Satisfaction and Well-being:
- Employee Net Promoter Score (eNPS).
- Burnout indicators like late-night activity or lack of PTO (Paid time off) usage.
- Technology satisfaction scores regarding local dev environments and build tools.
- Retention rates within specific teams or domains.
Performance (P)
Performance focuses on the outcomes of a system rather than the volume of work. The primary question is: Did the code written reliably do what it was supposed to do? Performance is often difficult to quantify because it involves many variables. High-performing teams focus on value delivery and system health.
Key signals for Performance:
- Change failure rate (percentage of deployments causing issues).
- Mean time to recovery (MTTR) from production incidents.
- Customer adoption and feature usage stats.
- Code quality indicators like complexity scores and test coverage.
Activity (A)
Activity is the count of actions completed during work. Most teams already track this, but the SPACE framework warns that it provides limited insight. Activity should be used to identify bottlenecks, not to rank people. It helps architects understand workload distribution and deployment cadence.
Key signals for Activity:
- Number of code reviews completed per week.
- Release frequency and deployment counts.
- Sprint completion rates at the team level.
- Build counts in CI/CD pipelines.
Communication and collaboration (C)
Communication captures how effectively people share information and work together. Poor communication kills more projects than bad code. This dimension evaluates the quality of communication channels and documentation practices. High collaboration leads to fewer bugs and better architectural consistency.
Key signals for Communication and collaboration:
- Pull request review time (how long code sits waiting).
- Quality and thoughtfulness of code review comments.
- Documentation update frequency and discoverability.
- Cross-team dependency management and meeting effectiveness.
Efficiency and Flow (E)
Efficiency and flow gauge progress made without interruptions. Flow is the ability to work with focus and enjoyment. Interruptions significantly impact development time and cognitive load. This dimension is the “engine health check” for a delivery system.
Key signals for Efficiency and Flow:
- Number of handoffs between different teams in a process.
- Perceived ability to stay in a “flow state” for deep work.
- Cycle time from “code start” to “production.”
- Ratio of active work time to waiting time in the pipeline.
How to Start Using the SPACE Framework
Implementing the SPACE framework requires a strategic mindset shift. It is not about replacing every metric you have. It is about balancing them. The goal is to move from monitoring people to monitoring workflows.
The 3×3 Selection Strategy
Engineering leaders should start by choosing three dimensions of SPACE to prioritize. For each dimension, select at least one metric to track as a KPI. This provides a holistic view without overwhelming the team with data. A common starting combination is Satisfaction (S), Performance (P), and Efficiency (E).
| Step | Action | Objective |
| 1 | Select 3 Dimensions. | Avoid “data swamp” and stay focused. |
| 2 | Benchmark Baseline. | Establish historical context for your teams. |
| 3 | Compare to Industry. | Understand what “good” looks like. |
| 4 | Identify Bottlenecks. | Focus on flow inhibitors like long PR reviews. |
| 5 | Automate Reporting. | Keep metrics top-of-mind with dashboards. |
Benchmarking against nowadays Standards
Visibility is useless without context. Leaders must know where their teams stand compared to elite performers. In 2026, performance tiers have become more granular. Only 9.4% of teams achieve lead times of less than one hour.
| Metric | Elite Performance (2026) | Median Performance (2026) |
| Lead Time for Changes | < 1 hour | 1 day – 1 week |
| Deployment Frequency | On demand (multiple per day) | Weekly – Monthly |
| Change Failure Rate | < 2% | 8% – 16% |
| PR Review Time | < 4 hours | 24+ hours |
| eNPS / Satisfaction | 8.5+ / 10 | 6.5 / 10 |
The Productivity Audit Checklist
Engineering leaders must conduct regular audits to ensure their measurement systems are enablers, not blockers. This audit should focus on throughput, sustainability, and developer experience.
Strategic & Business Alignment
- [ ] Do 70% of engineering hours go to “Planned Work” vs 30% to “Reactive Work”?
- [ ] Is there a documented career ladder that defines technical vs management paths?
- [ ] Are tech investments mapped directly to business OKRs and growth metrics?
Operational Health (DORA + Activity)
- [ ] Can the team deploy to production multiple times per day on demand?
- [ ] Is the “Change Failure Rate” below 15% consistently?
- [ ] Does the MTTR for critical incidents remain under one hour?
- [ ] Are build times monitored, and do they stay under 10 minutes?
Developer Experience (SPACE)
- [ ] Are quarterly anonymous developer satisfaction surveys being conducted?
- [ ] Does the team maintain an 8+/10 satisfaction score?
- [ ] Is “PR Review Time” monitored, and is the target under 4 hours?
- [ ] Are there “no-meeting” blocks enforced to protect flow state?
Infrastructure & Innovation (AI/DOMA)
- [ ] Does an AI risk governance matrix exist for all agentic tools?
- [ ] Is the system architecture following DOMA principles with clear gateways?
- [ ] Are technical debt reduction targets set for every release cycle?
Synthesis: Towards a Mentoring-Driven Engineering Culture
True productivity comes from enabling minds, not just tracking keyboards. The transition to the SPACE framework is a move from control to trust. The role of a leader is to architect resilient systems and mentor teams through complexity.
The Impact of psychological Safety
High-performing teams require psychological safety to admit mistakes and learn. Measuring performance as “Outcomes” rather than “Outputs” supports this safety. When engineers are not afraid of being judged by a “commit leaderboard,” they focus on solving hard problems.
Closing the Knowledge Gap
The “Activity” dimension reveals when teams are becoming too dependent on a few experts. Leaders should use this data to encourage pairing and knowledge sharing. Protecting “Flow” and “Satisfaction” ensures that these experts do not burn out and leave.
Conclusion: Take the 15-Minute Productivity Audit
Engineering leadership is about constant iteration. Do not try to implement everything today. Start by identifying your biggest pain point. Is it long review times? High burnout? Frequent failures?
Your Next Step: Perform a 15-minute audit of your team’s “Flow Efficiency.”
- Open your issue tracker.
- Pick three recently completed features.
- Calculate the time they spent in a “Waiting” state (for review, for QA, for deployment) vs “Active” coding time.
- If the efficiency is below 40%, you have a process bottleneck that no amount of AI can fix.
Let’s move beyond the “Distributed Mud” and build software that provides lasting value.